Are you spending more or less on Google Ads than businesses like yours? A new Spend Benchmarks report gives some advertisers a way to compare their weekly spend and clicks with a peer group.
If you have wondered whether your budget is keeping pace with similar businesses, you may find the figures interesting. However, spending less than your peers does not automatically mean you need to increase. Generating more clicks also doesn’t prove that your campaigns are delivering better results either. What matters in all of this is whether your clicks turn into valuable leads or sales. And whether they do so at a cost your business can afford.
The report gives you a starting point for investigating your account. Here, we explain what the comparison shows, how to put it alongside other data and what to check first before making any changes to your Google Ads budget.
What does the Spend Benchmarks report show?
The Spend Benchmarks report appears in the Overview section of some Google Ads accounts. It shows your weekly spend and clicks alongside figures for a group of businesses deemed to be similar (according to Google). You can see whether your account spent more or less than the peer figure during that week and also whether you received more or fewer clicks.
In one example shared when the report was spotted, an account spent €284 in a week compared with €268 for its peer group. It received 912 clicks, against a peer figure of 765. If you look at both of these measures together, it tells you more than a budget comparison does. In this example, the account spent slightly more and received considerably more clicks.
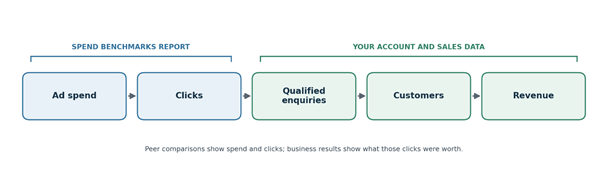
It’s important to realise, though, that the report doesn’t tell you whether those clicks converted. An account could attract plenty of inexpensive visits from people who never buy. Another might pay more to reach people but that audience might be ready to make an enquiry. The peer group also cannot tell you whether its businesses have the same locations, products or commercial goals as yours. It’s important to consider all of these aspects and not just focus on the numbers.
How should you read the spend and click figures together?
Start by looking at the direction of both figures:
- If you spend more than your peers and receive more clicks, you may be reaching a larger audience.
- If you spend more but receive fewer clicks, your traffic may cost more.
The figures could reflect a competitive market, a different campaign mix or a focus on searches with stronger buying intent. They don’t distinguish between all of the possible explanations.
The same applies when your budget is lower. Fewer clicks might mean you are missing opportunities. It could also mean simply that your campaigns are tightly focused on the people most likely to become customers. More clicks for less spend looks efficient at first glance, but what do they do after arriving on your site?
Use a three-step approach to dig deeper:
- Divide your own spend by clicks to calculate your average cost per click over the same period.
- Look at how many of those clicks became enquiries or sales.
- Work out what each result cost and, where possible, the revenue it produced.
An account with fewer clicks can still produce a better return if those visitors are more likely to buy.
Avoid drawing a firm conclusion from one week. A promotion, seasonal change or shift in search demand could affect both spend and clicks. Compare the report with your own performance over a longer period, especially if you have recently changed budgets, targeting or campaign settings.

Why might your peers have different budgets?
Two businesses can sell similar products and still need very different Google Ads budgets. A local company serving one city has a smaller potential audience than a national competitor. Even if both appear in the same broad sector, the number of searches they can reach may differ considerably.
Their goals may differ too. One business might advertise only its most profitable service. Another promotes an entire product range. A company launching in a new area may be willing to spend more to attract its first customers. An established business with a steady flow of enquiries may have little reason to match that pace.
Profit margins matter as much as volume. If one advertiser earns substantially more from each sale, it may be able to pay more for a click or lead and still make a healthy return. The same acquisition cost could be difficult to justify for a business with lower margins. Budgets may also shift during seasonal peaks, sales campaigns or periods when a company has spare capacity.
Accounts can contain different campaign types. An advertiser using Search, Shopping and Performance Max could have a different pattern of spend and clicks from one running a tightly focused Search campaign. When you see a gap between your figures and the peer benchmark, consider the markets you serve and the campaigns you run before deciding what that gap means.
What wider industry benchmarks add
The Spend Benchmarks report compares your account with a peer group. Wider research can give you another perspective on how much businesses spend, although it cannot set an appropriate budget for an individual advertiser.
One study of Google Ads accounts found a broad spread in monthly budgets: 24% of the accounts studied spent under $1,000, 39% spent between $1,000 and $10,000, and 37% spent over $10,000. The data came from 15,666 accounts.
NB: It’s worth noting that these figures are in US dollars and are not a representative sample of all Google Ads advertisers. The study also covered monthly account spend, while Google’s new report is a weekly comparison. Nevertheless, they illustrate the range of budgets in one substantial dataset.
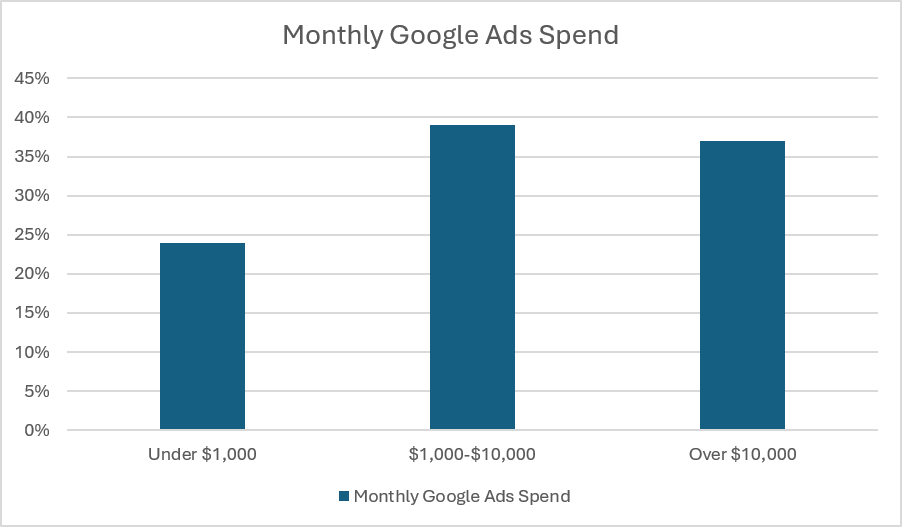
Data from Our Biggest Google Ads Performance Study Yet: What We Found | WordStream
What the figures don’t tell us is which spending band performs best. It’s not as simple as that, unfortunately.
A higher budget might buy more clicks. It may also buy less relevant traffic or exhaust the most promising demand. Equally, a small budget could be highly efficient. Yet, it might leave valuable searches unanswered.
Industry cost-per-click and cost-per-lead figures can help you understand the competitive environment. You do need to make sure you’re always comparing like for like, i.e., comparing the same market and campaign type.
It’s useful to use external benchmarks to form a question about your account, then answer it with your own data. Can you reach enough potential customers at your current budget? Which enquiries become sales? How much can you afford to pay to acquire each new customer? Those answers matter more than occupying a particular spending band.
What to investigate in your own account
Start with your conversion tracking. Check which actions count as conversions and whether they reflect what your business wants to achieve. A submitted form may be a useful lead, but a qualified enquiry or completed sale tells you more about the value of your advertising. If sales happen after an initial enquiry, consider whether those later outcomes can be connected to your campaigns.
Next, examine performance by campaign. Don’t rely on the account total. Find out where the budget goes, which campaigns produce valuable results and what they cost. For Search campaigns, the search terms report can show which searches triggered your ads. If irrelevant terms are consuming spend, it might be more useful to redirect that budget than increase it.
Consider a hypothetical example:
- Two campaigns each spend £500 in a month.
- Campaign A generates 20 qualified enquiries, at £25 each.
- Campaign B generates five, at £100 each.
- If both attract similar customers, moving some of Campaign B’s budget to Campaign A could be a sensible first test.
- But if B’s enquiries regularly become much larger sales, the higher cost may be justified. The peer report cannot reveal that difference; your lead and sales data can.
Look within each campaign as well. Performance can vary by location, device, product and the searches people use. If one region produces qualified enquiries while another generates many clicks with few sales, an account-wide comparison will hide the difference. Check landing pages too. A relevant ad can still lose potential customers if the page does not answer their questions or makes it difficult to enquire. Once you know whether a low click total is a budget constraint, narrow targeting or a problem after the click, you can do something about it.
For Search campaigns, check Search lost IS (budget). This estimates the share of eligible impressions missed because of insufficient budget. A high figure may mean you’ve got room to grow. First, though, confirm that the traffic you already receive produces worthwhile results. Key Principles’ PPC management approach considers tracking, targeting and conversion rates alongside spend, so budget decisions can be judged against business goals.
When increasing spend makes sense
A peer benchmark can prompt you to review your budget. But the case for increasing it should come from your own results. The clearest opportunity is a campaign that already brings in valuable customers at an acceptable cost and appears to have room to reach more of them.
If a Search campaign is already producing profitable results but its budget prevents it from appearing in some eligible searches, it may be worth testing a cautious increase. The extra spend will only be worthwhile if it brings in enough additional enquiries or sales at an acceptable cost. As an account scales, the next customer may cost more to reach than existing customers. This is why a modest test provides better evidence instead of you raising your budget overnight to match the peer figure. Allow enough time to assess the results. This is particularly important if sales usually happen some time after the first click.
Consider what happens after a new customer arrives. Can your team handle more enquiries? Do you have enough stock or appointment capacity? If your goal is lead generation, are you measuring which enquiries become paying customers? If you end up generating leads cheaply, it might be less attractive if few of them turn into sales.
Set a clear goal for any change. Raise the budget in a controlled way, then monitor both the volume and quality of results. If costs rise without a worthwhile increase in customers or revenue, review where the additional money went and whether your targeting still fits your goals.
If you would like help judging whether your campaigns have room to grow, a strategy session with Key Principles can put the benchmark alongside your business goals and account performance.
A short decision checklist
Before changing your Google Ads budget because of the peer comparison, work through these questions:
- Are you comparing the right period? Check the week shown in the report against promotions, seasonal demand and recent campaign changes.
- What is your current spend producing? Look at qualified enquiries, sales, customer value and the cost of acquiring them.
- Is a successful campaign limited by budget? For Search campaigns, examine Search lost IS (budget) alongside conversion performance.
- Could you use your existing spend better? Identify campaigns or search terms that consume budget without helping you meet your goals.
- Can you handle more customers? Check stock, team capacity and appointments before seeking additional demand.
- How will you judge the test? Set an acceptable cost per lead or sale and review results before increasing spend again.
These checks give you a decision you can explain in commercial terms, whether you increase the budget, move it between campaigns or leave it where it is.
Make the benchmark useful to your business
Google’s Spend Benchmarks report makes it easier to see how your spend and clicks compare with similar advertisers. The comparison is most valuable when it leads to a closer examination of campaign results. A bigger budget may help if profitable campaigns are missing opportunities. In other cases, improving the results from your current spend should come first.
If you need help interpreting the figures and deciding what to do next, contact Key Principles to discuss your Google Ads account and business goals.


